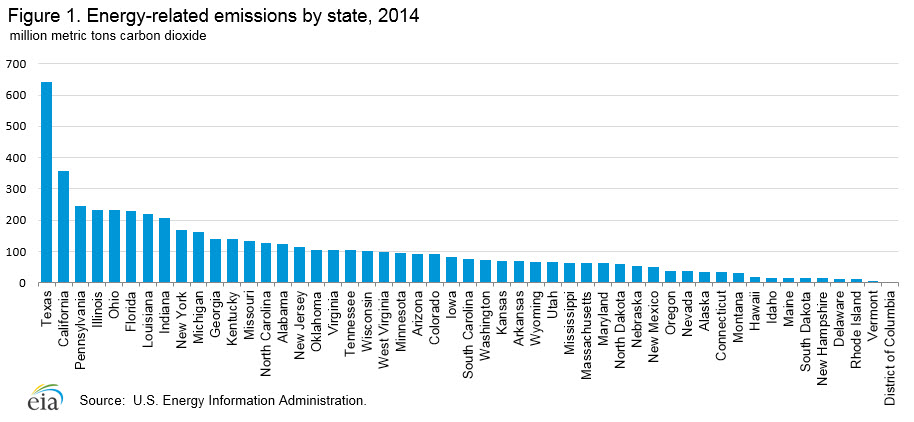
Take one look at the state-by-state CO2 admission rates and it is immediately apparent that two states stand out from the rest, California and Texas. Of these two, Texas stands head and shoulders over California. Over the span of ten years Texas produced over 7.5 trillion metric tons of CO2, That is more than the 19 lowest emissions states plus D.C. combined. Amost 12% of al the CO2 emissions generated in the United States came from Texas. Californai produced 6.6% while Pensyulvania, Ohio, Florida and Illinois each produce between 4.6% and 4% of the nations CO2 emissions.
What are the implications for carbon conservation when more than one-sixth (18.3%) of all CO2 emissions are coming from just two states? For one thing it suggests that focusing national efforts on Texas and California can produce the biggest improvements in the short term. Furthermore, the data suggests that half the states with the lowest emissions are already working harder to reduce further carbon emissions that higher CO2 producing states. Among the higher CO2 producing states, Florida, Georga, Kentucky, Missouri, Oklahoma, Arizona, Colorodo and South Carolina increased their carbon polution between 2000 and 2010. Of these, the states with the highest rate of increase were Arazona (9.9%) and Colorado (11.8%). The largest state increase in carbon emissions over ten years was Nabraska (16.0%). So focusing our national effort on just a hand full of states might be the best strategy to make the biggest and quickest improvements in our carbon footprint in the world.
What are the implications for carbon conservation when more than one-sixth (18.3%) of all CO2 emissions are coming from just two states? For one thing it suggests that focusing national efforts on Texas and California can produce the biggest improvements in the short term. Furthermore, the data suggests that half the states with the lowest emissions are already working harder to reduce further carbon emissions that higher CO2 producing states. Among the higher CO2 producing states, Florida, Georga, Kentucky, Missouri, Oklahoma, Arizona, Colorodo and South Carolina increased their carbon polution between 2000 and 2010. Of these, the states with the highest rate of increase were Arazona (9.9%) and Colorado (11.8%). The largest state increase in carbon emissions over ten years was Nabraska (16.0%). So focusing our national effort on just a hand full of states might be the best strategy to make the biggest and quickest improvements in our carbon footprint in the world.
US ENERGY INFORMATION ADMINISTRATION
http://www.eia.gov/environment/emissions/state/analysis/
Release Date: May 13, 2013 | Next Release Date: May 2014 | full report State-Level Energy-Related Carbon Dioxide Emissions, 2000-2010
Overview
Energy-related carbon dioxide emissions vary significantly across states (Figure 1), whether considered on an absolute or per capita basis. The overall size of a state, as well as the available fuels, types of businesses, climate, and population density, play a role in both total and per capita emissions. Additionally, each state’s energy system reflects circumstances specific to that state. For example, some states are located near abundant hydroelectric supplies, while others contain abundant coal resources.This paper presents a basic analysis of the factors that contribute to a state's carbon dioxide profile. This analysis neither attempts to assess the effect of state policies on absolute emissions levels or on changes over time, nor does it intend to imply that certain policies would be appropriate for a particular state.
The term "energy-related carbon dioxide emissions" as used in this paper, includes emissions released at the location where fossil fuels are used. For feedstock application, carbon stored in products such as plastics are not included in reported emissions for the states where they are produced.
| Table 1. State energy-related carbon dioxide emissions by year (2000 - 2010) | ||||||||||||||
| million metric tons carbon dioxide | ||||||||||||||
| Change | ||||||||||||||
| 2000 to 2010 | ||||||||||||||
| State | 2000 | 2001 | 2002 | 2003 | 2004 | 2005 | 2006 | 2007 | 2008 | 2009 | 2010 | Percent | Absolute | |
| District of Columbia | 4.3 | 4.1 | 4.2 | 3.9 | 4.0 | 3.9 | 3.2 | 3.4 | 3.1 | 3.2 | 3.3 | -23.6% | -1.0 | 40.6 |
| Vermont | 6.8 | 6.6 | 6.4 | 6.5 | 7.0 | 6.8 | 6.7 | 6.6 | 6.1 | 6.3 | 6.0 | -10.8% | -0.7 | 71.9 |
| Rhode Island | 11.6 | 12.1 | 11.6 | 11.3 | 10.8 | 11.0 | 10.4 | 11.0 | 10.6 | 11.3 | 11.0 | -4.8% | -0.6 | 122.6 |
| South Dakota | 14.1 | 13.4 | 13.7 | 13.6 | 13.7 | 13.2 | 13.3 | 13.9 | 15.1 | 14.9 | 15.1 | 7.3% | 1.0 | 154.1 |
| Delaware | 16.3 | 15.7 | 15.5 | 16.1 | 16.1 | 17.0 | 15.8 | 16.7 | 15.9 | 11.8 | 11.7 | -27.9% | -4.5 | 168.7 |
| Idaho | 15.6 | 15.5 | 14.9 | 14.2 | 15.5 | 15.7 | 15.8 | 16.3 | 15.8 | 15.4 | 16.2 | 4.0% | 0.6 | 170.9 |
| New Hampshire | 17.5 | 16.9 | 17.6 | 20.8 | 21.9 | 21.3 | 19.4 | 19.3 | 19.1 | 17.3 | 17.0 | -2.8% | -0.5 | 208.0 |
| Hawaii | 18.8 | 19.2 | 20.5 | 21.5 | 22.6 | 23.2 | 23.5 | 24.4 | 19.7 | 18.9 | 18.9 | 0.7% | 0.1 | 231.1 |
| Maine | 22.3 | 22.4 | 24.0 | 23.4 | 24.0 | 23.1 | 21.3 | 21.0 | 19.4 | 18.6 | 18.5 | -17.1% | -3.8 | 238.1 |
| Montana | 31.3 | 31.9 | 30.7 | 32.7 | 34.5 | 35.5 | 35.8 | 37.8 | 36.1 | 32.5 | 34.9 | 11.4% | 3.6 | 373.6 |
| Connecticut | 42.8 | 41.5 | 39.9 | 42.3 | 44.4 | 43.9 | 40.9 | 40.3 | 38.2 | 36.5 | 36.9 | -13.7% | -5.8 | 447.7 |
| Oregon | 41.2 | 40.6 | 39.1 | 39.3 | 40.6 | 41.0 | 40.3 | 43.8 | 43.2 | 41.2 | 40.3 | -2.4% | -1.0 | 450.6 |
| Nevada | 45.3 | 44.6 | 41.4 | 43.4 | 47.7 | 49.8 | 41.5 | 41.8 | 41.2 | 39.7 | 38.1 | -15.9% | -7.2 | 474.3 |
| Alaska | 44.3 | 43.4 | 43.6 | 43.5 | 46.8 | 48.1 | 45.8 | 44.1 | 39.5 | 37.9 | 38.7 | -12.6% | -5.6 | 475.6 |
| Nebraska | 41.4 | 42.7 | 42.2 | 43.0 | 43.1 | 43.5 | 44.1 | 44.5 | 46.5 | 46.8 | 48.0 | 16.0% | 6.6 | 485.7 |
| North Dakota | 50.8 | 51.7 | 51.4 | 50.9 | 49.5 | 52.4 | 50.8 | 52.6 | 53.1 | 51.4 | 52.5 | 3.3% | 1.7 | 567.1 |
| New Mexico | 58.0 | 58.2 | 55.2 | 57.3 | 58.5 | 59.1 | 59.9 | 59.1 | 57.6 | 58.5 | 54.8 | -5.5% | -3.2 | 636.2 |
| Arkansas | 63.2 | 62.4 | 60.9 | 61.3 | 61.9 | 59.7 | 61.6 | 63.1 | 63.7 | 61.6 | 66.1 | 4.6% | 2.9 | 685.8 |
| Wyoming | 62.7 | 63.0 | 61.7 | 63.4 | 63.4 | 62.8 | 63.7 | 66.1 | 66.8 | 63.7 | 64.9 | 3.5% | 2.2 | 702.3 |
| Mississippi | 60.6 | 69.4 | 61.9 | 63.2 | 64.8 | 63.2 | 65.4 | 67.7 | 64.1 | 60.4 | 65.5 | 8.0% | 4.9 | 706.1 |
| Utah | 65.1 | 62.9 | 62.1 | 62.7 | 65.3 | 67.0 | 68.3 | 70.4 | 69.9 | 65.0 | 64.2 | -1.3% | -0.9 | 723.0 |
| Kansas | 76.1 | 71.8 | 76.6 | 78.4 | 75.8 | 72.0 | 72.1 | 80.1 | 76.9 | 75.0 | 75.0 | -1.3% | -1.0 | 829.7 |
| Maryland | 77.5 | 78.0 | 77.9 | 80.4 | 82.0 | 83.9 | 77.5 | 78.1 | 74.7 | 71.4 | 70.5 | -9.0% | -7.0 | 852.0 |
| Washington | 82.8 | 79.4 | 72.8 | 74.5 | 76.7 | 78.3 | 76.3 | 81.8 | 79.6 | 77.5 | 76.1 | -8.1% | -6.7 | 855.9 |
| Massachusetts | 82.2 | 82.1 | 82.9 | 83.8 | 82.6 | 84.3 | 76.4 | 80.0 | 77.2 | 71.0 | 73.0 | -11.2% | -9.2 | 875.6 |
| Iowa | 77.7 | 76.6 | 77.2 | 76.4 | 78.9 | 78.9 | 80.2 | 85.7 | 88.3 | 83.8 | 88.7 | 14.1% | 11.0 | 892.4 |
| South Carolina | 79.3 | 78.0 | 79.2 | 79.5 | 87.1 | 85.7 | 86.4 | 87.0 | 85.5 | 80.7 | 84.0 | 5.9% | 4.7 | 912.5 |
| Colorado | 84.7 | 92.8 | 90.9 | 90.0 | 93.1 | 95.4 | 96.4 | 99.2 | 97.6 | 93.7 | 96.5 | 13.9% | 11.8 | 1,030.3 |
| Arizona | 86.0 | 88.3 | 87.7 | 89.3 | 96.6 | 96.7 | 100.0 | 102.2 | 103.1 | 94.6 | 95.9 | 11.6% | 9.9 | 1,040.5 |
| Minnesota | 97.7 | 94.7 | 97.3 | 101.0 | 100.6 | 101.7 | 99.1 | 100.9 | 100.6 | 93.1 | 93.4 | -4.4% | -4.3 | 1,080.3 |
| Wisconsin | 107.5 | 105.5 | 106.7 | 104.3 | 107.1 | 110.5 | 102.7 | 104.7 | 105.7 | 96.7 | 99.2 | -7.7% | -8.3 | 1,150.6 |
| Oklahoma | 100.1 | 101.4 | 101.6 | 103.5 | 99.8 | 106.9 | 110.2 | 109.6 | 113.1 | 104.9 | 103.4 | 3.4% | 3.4 | 1,154.5 |
| West Virginia | 113.4 | 103.5 | 116.2 | 112.5 | 109.8 | 111.9 | 112.2 | 114.6 | 110.6 | 89.1 | 98.9 | -12.7% | -14.4 | 1,192.8 |
| Virginia | 122.3 | 120.0 | 118.5 | 122.2 | 126.5 | 128.5 | 122.0 | 127.7 | 117.4 | 106.3 | 109.8 | -10.2% | -12.5 | 1,321.3 |
| Tennessee | 125.2 | 124.2 | 123.2 | 120.9 | 123.0 | 124.6 | 127.0 | 126.7 | 120.3 | 100.3 | 107.1 | -14.5% | -18.1 | 1,322.4 |
| New Jersey | 121.1 | 118.5 | 118.9 | 119.8 | 122.6 | 127.6 | 120.2 | 128.6 | 124.3 | 110.4 | 115.4 | -4.7% | -5.7 | 1,327.5 |
| Missouri | 125.4 | 131.1 | 131.8 | 138.3 | 140.0 | 143.0 | 141.6 | 140.8 | 137.9 | 131.6 | 135.7 | 8.2% | 10.3 | 1,497.2 |
| Alabama | 140.4 | 132.0 | 136.7 | 137.2 | 139.7 | 141.5 | 144.0 | 146.1 | 139.2 | 119.8 | 132.7 | -5.5% | -7.7 | 1,509.3 |
| North Carolina | 147.7 | 143.1 | 144.3 | 144.7 | 148.2 | 152.7 | 147.4 | 153.6 | 149.0 | 132.9 | 142.9 | -3.3% | -4.8 | 1,606.4 |
| Kentucky | 144.7 | 148.1 | 148.3 | 143.9 | 150.9 | 153.2 | 156.1 | 156.4 | 153.7 | 143.7 | 150.7 | 4.2% | 6.1 | 1,649.7 |
| Georgia | 167.9 | 160.3 | 165.1 | 167.5 | 173.3 | 183.9 | 181.5 | 184.6 | 173.5 | 163.4 | 173.7 | 3.4% | 5.8 | 1,894.7 |
| Michigan | 192.6 | 188.5 | 187.9 | 184.7 | 187.4 | 189.3 | 178.2 | 181.2 | 175.2 | 164.4 | 165.9 | -13.9% | -26.7 | 1,995.1 |
| New York | 211.4 | 206.7 | 200.8 | 210.1 | 213.9 | 210.7 | 192.5 | 199.4 | 190.5 | 175.5 | 172.8 | -18.3% | -38.6 | 2,184.4 |
| Louisiana | 239.9 | 211.9 | 219.8 | 214.6 | 226.2 | 221.7 | 236.0 | 234.5 | 221.7 | 203.9 | 223.5 | -6.8% | -16.4 | 2,453.6 |
| Indiana | 238.2 | 228.6 | 231.7 | 236.9 | 237.8 | 236.7 | 235.0 | 234.7 | 231.5 | 208.5 | 219.1 | -8.0% | -19.1 | 2,538.6 |
| Illinois | 232.1 | 223.1 | 225.1 | 227.7 | 235.2 | 242.0 | 233.9 | 242.1 | 240.7 | 226.1 | 230.4 | -0.7% | -1.7 | 2,558.3 |
| Florida | 239.2 | 238.1 | 241.3 | 244.9 | 257.3 | 260.9 | 259.5 | 257.8 | 240.2 | 226.3 | 246.0 | 2.8% | 6.7 | 2,711.7 |
| Ohio | 264.0 | 254.5 | 260.3 | 267.4 | 262.5 | 269.7 | 263.0 | 268.9 | 261.9 | 237.6 | 249.1 | -5.6% | -14.9 | 2,858.9 |
| Pennsylvania | 276.3 | 263.4 | 270.1 | 273.0 | 276.6 | 280.0 | 274.1 | 277.6 | 264.9 | 246.0 | 256.6 | -7.1% | -19.7 | 2,958.7 |
| California | 381.3 | 385.8 | 384.9 | 389.5 | 391.5 | 389.0 | 397.5 | 403.7 | 389.8 | 375.9 | 369.8 | -3.0% | -11.4 | 4,258.6 |
| Texas | 711.3 | 704.1 | 715.8 | 706.4 | 709.7 | 677.8 | 675.2 | 676.7 | 653.3 | 624.9 | 652.6 | -8.3% | -58.8 | 7,507.7 |
| Total1 | 5,879.9 | 5,772.4 | 5,810.0 | 5,857.5 | 5,968.8 | 6,000.4 | 5,921.6 | 6,029.0 | 5,842.9 | 5,441.8 | 5,631.3 | -4.2% | -248.6 | 64,155.6 |
| 1For the United States as a country see, EIA, Monthly Energy Review, Section 12: Environment. Differing methodologies between the two data series causes | ||||||||||||||
| the total for all states to be slightly different from the national-level estimate. The amount varies no more than 0.5 percent. See Appendix A for details on | ||||||||||||||
| the data series differences. | ||||||||||||||
| Source: U.S. Energy Information Administration (EIA), State Energy Data System and EIA calculations made for this analysis. | ||||||||||||||

No comments:
Post a Comment
Please feel free to comment or make suggestions