Tuesday, September 1, 2020

THE DAILY PANDEMIC DIARY FOR SEPTEMBER 2020

by Brian T. Lynch, MSW

(If you are returning to this site just skip down to today's data table and comments below)

Welcome to the Daily Pandemic Diary for September. 2020. The daily statistical table below is divided into four parts, the U.S. daily global share of new cases in the prior 24 hour period, the U.S. daily global share of COVID-19 related deaths in the same 24 hour period, a commentary section, and a graphic of the raw data table from which the raw data is reported.  The data comes from the international Worldometer.info website. The main purpose here is to provide a daily snapshot of how the U.S. is doing relative to the world as a whole. The twenty-four-hour lookback is based on Grenich Mean-time. The Total Tests/U.S. The population is the ratio of all COVID-19 tests given relative to the population of only one test was given per person.

This blog continues the daily collection of data begun in the Daily Update blog mentions below and the Daily Pandemic Diary for the past months.

U.S. National Health Emergency

Day 200 September 30, 2020
Comments: Welcome to day 200 or our U.S. National Health Emergency! And to the end of September. Time to review. 

1. Per capita, we are currently still the hottest hotspot on Planet Earth for the coronavirus. We are second only to India in the number of daily cases. India has over a billion more people, so they are actually doing much better than are we. And we still have the highest total number of cases in the world, 21.9% of all COVID-19 cases.

2. We are still worst in the world for the number of COVID-19 deaths (20.8% of the global total) with over 210,000 dying to date and an average of 785 people dying per day in September. We are second in daily new deaths on most days. We consistently have the greatest number of active cases in the world and the greatest number of critically ill patients in the world.

3. In regards to testing for COVID-19, we have dropped to 20th place in the world for the number of tests given per one-million population. Our testing capacity increased by 4.7% in September while our new cases this month increased over August's total by 20%. Still, this minor increase is an improvement over last month's decline in daily testing.

4. If there is anything positive to report, it is that overall the September numbers were better than August and July numbers. This apparent improvement has to be tempered, however. Total COVID-19 cases and deaths did rise less sharply than in August and July, and against the background of the world as a whole, we are doing less badly. That said, the global pattern of a slower rise in new cases and deaths from July to September is nearly identical to the pattern we see in the United States. Put another way, the pandemic is growing somewhat faster globally than it is nationally, but the rates of monthly changes here and around the world are nearly identical. The improvements in the numbers we see nationally in September are proportional to what is happening globally and are not unique to the U.S. (see table below). In looking at the most recent trend lines, both the U.S. and the world appear to be on the cusp of more rapidly rising numbers of cases and deaths.

To summarize, we are still handling the pandemic badly compared with most other nations. The pandemic is growing slower here than abroad, but the slower monthly rate of increased community spread and deaths in September is a global phenomenon. It is not the result of something extra special that we are doing to bring down the numbers. Unless mask-wearing becomes a symbol of national unity rather than a partisan statement, we can expect a third and higher wave of cases between now and the new year.


U.S. National Health Emergency

Day 199 September 29, 2020
Comments: I have no specific comments today. I am working on a longer piece reviewing safety precautions we should consider at our activity moves indoors. 


U.S. National Health Emergency

Day 198 September 28, 2020
Comment: To give a sense of how the spread of the COVID-19 virus has changed recently the top five states with the highest number of cases over the past 24 hours is presented below. Who would have imagined that Wisconsin and Tennessee would have edged out Florida and Texas at this point? Our testing numbers continue to remain flat and our overall rate of new infections appears to be rising slightly, not falling as we had hoped. The sustained rate of community infection spread has moved from metro regions in a few states to a broader community spread in many states. 


Regarding the 2.17 percentage point drop in the U.S. 7-day average testing positivity rates between September 16th and 17th (previously discussed earlier this month), I have emailed doctors at Johns Hopkins University and will let you know their explanation when it is received.  


U.S. National Health Emergency

Day 197 September 27, 2020
Comments: About 72 hours ago I wrote that by the end of the week the world would see one-million people dead from the Coronavirus. I was off by less than 12 hours, that's how predictable this has all become. As I write, the world has crossed that milestone, 1,000,717 people have succumbed to the pandemic as of 3:30 pm on Sunday, 9/27/2020. May they all rest in peace and may their families be comforted in their loss. 

The pandemic is taking from the world a weekly average of over 5,300 people per day while the overall number of new daily infections continues to climb. 


U.S. National Health Emergency

Day 196 September 26, 2020


Comments: The United States remains stuck in place as the country with the second-highest number of new infection each day, and the most total COVID-19 infections in the pandemic world. All the experts say this isn’t a good place to be heading into winter. The virulence of many viruses is seasonal, and human activity moves indoors during the colder months. This greatly increases the risk of transmission. By one glum assessment, we could see new cases jump from about 750 per day to 3,000 per day by January if we continue ignoring the recommended safety precautions (and continue getting bogus messages from your political leaders).


One resurgent message from the White House is that we should open up the economy and let the virus run its course to achieve herd immunity. The term “herd immunity” comes from the behavior of the American Bisson that, when threatened, gather together in a circle with the strongest animals on the outside and the most vulnerable in the center. In epidemiology, herd immunity is when the number of people immune to the virus is sufficient that those who are still vulnerable never come in contact with anyone infected with the virus. The percentage of the population that must be immune to achieve protection for those who aren’t immune depends on how contagious the virus. Measles is very contagious, for example, so over 92% of the population must be inoculated to keep the other 8% from contracting it. The contagion rate of the COVID-19 virus is still a scientific guess, but it will likely be an order of magnitude greater than the common flu for which 50% to 65% of the population must be inoculated and immune to protect those who are not.


With this in mind, we already lost over 206 thousand people to the virus and a new study indicates that just 10% of all American’s tested have some protective antibodies against the disease. You don’t have to be a math-wiz to see we would have to lose over a million more people to achieve herd immunity under this Administration's plan.  


U.S. National Health Emergency
Day 195 September 25, 2020


Comment: U.S. residents make up just one out of every twenty-five people on earth yet we have one out of every five cases of COVID-19 and coronavirus deaths. On these grim statistics, we are #1 in the world. On testing for COVID-19, we have dropped to 20th place. 

Testing of people with and without symptoms is essential for contact tracing, which is the best method available to get this disease under control. But then again, maybe more testing doesn't matter.  Contact tracing statistics are hard to come by, but information released last month in New Jersey wasn't good news. According to Governor Murphy, only 63% of those who tested positive in a one-week period could be contacted. Of those people contacted, 45% refused to provide any information about the people with whom they may have been in close contact. If this is typical in N.J., or in other states, it means that only 35% of people who test positive are allowing contact tracers to do their job. 

The irony is that we have voluntarily given up all of our privacy to corporate enterprises through our participation in social media. We get nothing in return for becoming products to be bought and sold in the information marketplace, yet we irrationally risk the life and health of everyone we know by not cooperating with contact tracers.

U.S. National Health Emergency

Day 194 September 24, 2020


Comments: How is the world doing with this pandemic? While the virus continues to spread and grow, things are clearly much better than they might have been. The spread of the infection has mostly continued to climb since the outbreak began, but at a much slower rate. Initially, the whole world was unprepared for the pandemic and medical treatment facilities were overwhelmed. This is reflected in the high initial rate of daily deaths. Note also how steeply death rates rose in the early days. This is the geometric rise that scientists predict when no safety precautions are in place to slow the progression of a novel virus. If masks, social distancing, handwashing, and lockdowns had not been implemented anywhere, the virus would have continued spreading and kill people at ever more rapid rates. But, as country after country took appropriate measures, the geometric rise in deaths and daily new cases declined and took a more linearly direction. 

From a global perspective, prevention measures adopted by most countries across the globe have saved millions of lives, and continues to save millions of lives. Unfortunately for us in the U.S.A., critics of science and prevention measures point to this success and claim it as proof that the virus is not as bad as scientists claimed instead of proof that these measures work.  

Before this week is over the world will have lost one million people to COVID-19. That milestone coming nine months into the pandemic, instead of many months sooner, represents an accomplishments in the saving of human lives. We are nine months closer to a vaccine or a cure. We are closer every day to scientific advances it will take to bring this disease under control.  


U.S. National Health Emergency
Day 193 September 23, 2020 

Comments: (First note below corrections on the number of daily tests given for the past two days. My error.)  

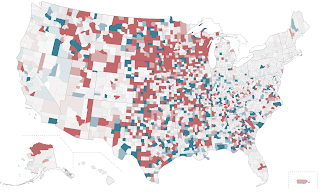
CNBC and other news outlets have reported that Coronavirus infections are increasing in the majority of states. National Geographic has an excellent website that tracks how states are doing from week to week in COVID-19 cases and deaths. This includes a map that provides great visual evidence. I am including the map here along with the key. Note that the darker the red, the more the cases, and the darker the blue, the fewer cases. The visual evidence shows how broad the rise is in new infections. The case members are less driven by geographic hotspots. At the same time, states and local municipalities are powerless to track down local outbreaks as the testing capacity needed for contact tracing isn't even being developed. We don't have the testing capacity necessary to match our infection rates and bring this epidemic under control. 


U.S. National Health Emergency
Day 192 - September 22, 2020

CORRECTION: COVID-19 TESTS GIVEN (24 HR) SHOULD READ 743,166


Comments: Today is the first day of Autumn and the 192nd day since Donald Trump declared a national health emergency. We remain stuck in second place in the world for the most number of new infections every day behind India, which has over a billion more people. Still, we have 2.5 times more active cases than India. Our seven day moving average of deaths from COVID-19 is down to 786 individuals per day which is still almost 250 people more dying every day then at the lowest point in July, between the first and second waves. Most states are still seeing increases in their testing positivity rates, but here there is an anomaly to point out. Prior to September 14th, the overall U.S. positivity rate was stable at just over 8%. Beginning on September 15th or 16th the national positivity rate dropped to just over 5% where it has remained since. (I never liked this metric). This testing data comes from John Hopkins Hospital which has been tracking positivity for many months. So far I have seen no mention of this unnatural drop in positivity, nor any explanations. I have written (via Tweet) to John Hopkins for an explanation.


U.S. National Health Emergency
Day 191 - September 21, 2020


CORRECTION: COVID-19 TESTS GIVEN (24 HR) SHOULD READ 856,29

Comments: We lost over 200,000 American’s to Covid-19 as of September 16th and that milestone of misery went almost unnoticed by everyone. It certainly went without comment by our commander in chief.  Let’s take a moment now to mourn our dead and lift up in our thoughts the families living with their losses. 


U.S. National Health Emergency
Day 190 - September 20, 2020


Comments: I hope we are not entering a new wave of infections, but the bar chart of moving 7-day average does suggest this possibility. California, Texas, Georga, Illinois, Arizona, North Carolina, and Tennessee are among the states showing this uptick in cases over the past week or more. 


In the meantime, our declining testing numbers are still very worrisome. VOX News has an article explaining why our testing has declined (see graph below). It reads in part:


If only we would listen. 


U.S. National Health Emergency
Day 189 - September 19, 2020


Comments: No Comments Today


U.S. National Health Emergency
Day 188 - September 18, 2020

Comments: Testing, one-two-three, testing!!! If you have been following the numbers, you may know by now that U.S. COVID-19 testing rates have stopped growing to meet our needs, and are in decline. The chart below clearly shows what's happening. The U.S. has dropped from 17th in the world for most tests per million, back to 19th. Given the size of our epidemic and population, this is a blow to our efforts to control the spread of the virus. Then, as if to support this trend, the CDC published new testing guidelines a few weeks ago that significantly loosened the criteria for COVID testing, recommending, among other things, that asymptomatic people exposed to the virus need not be tested.

Then we learned yesterday that the new CDC testing protocols did not come directly from the CDC but from the Trump Administration's political folks at Health and Human Services. The CDC scientists are angry and disturbed by the fake CDC recommendations, but apparently are powerless to make "substantial edits" to the document that was uploaded on their website by the Administration under the CDC credentials. This blatant political undermining of the world's most trusted public health agencies for President Trump's political ambitions amounts to an act of institutional vandalism. It also spotlights the huge failure of the United States to scale up COVID-19 testing to appropriate levels. In 188 days now the total number of COVID-19 tests given so far would not be enough to test a third of the U.S. population. Give the fact that people can be super-spreaders of the virus despite not having any symptoms themselves, suggesting that they not be tested and isolated if positive is like playing wack-a-mole without a mallet. We can never get ahead of the virus if we don't know who needs to be stopped from spreading the infection. Limiting testing now as a means to lower the apparent infection rate and make yourself look good in the eyes of the electorate, as Trump is doing is a death sentence for thousands of Americans


U.S. National Health Emergency

Day 187 - September 17, 2020


Comments:  No comments today.


U.S. National Health Emergency
Day 186 - September 16, 2020


Comments: 
grave·dig·ger /ˈɡrāvˌdiɡərnoun - A person who refuses to wear a mask or social distance from other people during a deadly pandemic

I am introducing this new definition today because of something I read in USA Today: 


There was also this: 


U.S. National Health Emergency
Day 185 - September 15, 2020


Comments: We are making progress in bending down the curve or new COVID-19 infections and deaths which is really a good thing. The potential remains, however, for the exponential growth of the infection without the efforts and sacrifices already being made. To put our current status into perspective lets compare where we are now to where we were on the initial wave of cases based on 7-day averages. 

Average Daily Deaths
  • The current low average of new daily deaths was 750 per day on September 10th. 
  • In the lull between the first and second waves, we achieved a low of 519 deaths per day on July 5th. 
  • March 30th was the last time the average daily deaths (488) dipped below 500 people per day. 
Average Daily New Cases
  • The current low average of daily new cases was 35,206 on September 12th. 
  • In the lull between the first and second waves, we achieved a low of daily new cases of 21,403 on June 11th. 
  • March 31st was the last time the average of daily new deaths (19,888) dipped below 21 thousand. 
In summary, when we bent down the curve on our initial wave we stopped our efforts well short of most other nations. This resulted in a second higher wave of new cases from which we are still recovering. Our current low average of new cases is 64% higher than during the mid-wave low in mid-June. The number of people dying of the virus now is still 45% higher than it was in early July. 


U.S. National Health Emergency
Day 184 - September 14, 2020


Comments: [No comments today]


U.S. National Health Emergency
Day 183 - September 13, 2020

Comment: [no comments today]


U.S. National Health Emergency
Day 182 - September 12, 2020


Comments: U.S. infection rates lately are hovering around 40k per day. Daily deaths are again over 1,000 per day. Sixteen states reported more than a thousand new cases yesterday and eleven states had more than five-hundred new cases.  Just 12 days into the month (182 days into this crisis) and we have lost almost 9,700 people so far. We are weeks away from the start of the flu season and Dr. Fauci just warned us to be prepared to "hunker down" in November. Meanwhile, we are first in several measures of the Coronavirus, including: 
#1 in total cases - 6,636,247
#1 in total deaths - 197,421
#1 in total recovered - 3,917,962
#1 in active cases - 2,529,862
#1 in serious/critical cases - 14,347 

Our national positivity rate of 8.16 remains above the WHO guidelines for opening up an economy. Our national COVIE-19 testing rank has slipped to 19th among nations. And Politico reports today that: 
"... since Michael Caputo, a former Trump campaign official with no medical or scientific background, was installed in April as the health department's new spokesperson, there have been substantial efforts to align the reports with Trump's statements, including the president's claims that fears about the outbreak are overstated, or stop the reports altogether."

The good news of declining national numbers is tempered by the number of states where the daily infection rate is still growing. And we are entering a cooler season that will result in more indoor activity where the risk of contagion is greater. 


U.S. National Health Emergency
Day 181 - September 11, 2020

Comment: As the graph below indicates, we do seem to be in a period of diminishing numbers of new infections. We had the third-highest number of new cases yesterday but we still had 27 thousand more cases than Argentina, the country with the fourth-highest number of new cases. Also, the low number of average daily new cases now is still higher than the peak was during the initial wave. So, we still have our work cut out for us.

I originally started this daily blog thread as a way to put the U.S. response to the global pandemic in perspective, particularly as information about the pandemic has been distorted and politicized. The recent revelations about what our President knew about the virus, and when he knew it (in his own words) gave impetus to reviewing the President's past comments in light of this information and in contrast to the growing number of new cases. That review can be read in a post entitled "

Chronology of Trump’s Misleading Statements Amid the Spread of New COVID-19 Case"  


One other brief comment today regarding an earlier commentary below about declining mortality rates. A friend of mine from Scotland pointed out that the increased testing coupled with the number of people who remain symptom-free despite testing positive might be enough to explain why the mortality rate has declined over time.  That is a very good point. While testing rates are still too low in the U.S. (17th in the world), it is still higher than it was initially. (Thank you, Linda!)


Comments: No comments today


U.S. National Health Emergency
Day 179 - September 9, 2020

Comments: No Comments today


U.S. National Health Emergency
Day 178 - September 8, 2020


Comments: It is difficult to believe that new daily cases and deaths have dropped off so sharply. I expect to see a correction soon. Despite the low reporting numbers, the U.S. still has the second most number of new infections in the world. 

I ended yesterday's comments by pointing out what appears to be a declining mortality rate from the COVID-19 virus in the United States. I wondered if this was true elsewhere in the world. Since then I checked on the data in other countries and found that the declining mortality rate over time is evident in other countries as well. It isn't unique to the U.S.A. Furthermore, it can't be attributed to a first wave eliminating the most vulnerable with a second wave sickening people who are in better health. The second wave of our epidemic took place in totally different regions in the U.S. with different populations. See the results in my latest blog post, "The Mystery of Declining COVID-19 Mortality"


U.S. National Health Emergency
Day 177 - September 7, 2020


Comments: The numbers all look very good from yesterday. Infection rates and deaths are all down in the U.S. and especially so in the three hotspot states of California, Texas, and Florida. Not much else should be said about that now as the reporting cycle is always lower on weekends, especially holiday weekends. We will have to wait for any corrections mid-week before celebrating. The happy exception is daily testing, which has jumped from about 800k per day to over a million tests per day over the past three days. This is a sudden jump and it is the first time we are seeing consistently higher numbers.  Positivity rates are correspondingly higher as well, so maybe this is a welcome trend in COVID-19 testing, time will tell.

I want to comment on yesterday's discussion of the changing mortality rate of the virus (see below). Looking at the differences in the peak in new cases and deaths between the April wave and the July/Aug wave of cases, it turns out that the peak number of deaths in April was 2.1 times higher than in the second wave, while the peak number of new cases in the second wave was 2.1 times higher than in the first wave. Talk about a mirror image! Wow! If the steep decline in the mortality rate of the virus is from mutations or improved treatments, rather than reporting issues than similar mortality declines should be evident around the world and not just in the United States.  This is something worth looking into.


U.S. National Health Emergency
Day 176 - September 6, 2020


Comments: So far this month the spread of new infections in the U.S. is trending upward, from 38.6 thousand new cases on September 1st. to 52.8 thousand new cases yesterday. At the same time, new case numbers are declining in the top hotspots of California, Texas, and Florida, meaning increases in other states are climbing faster than the top three are declining in new infections. India consistently has the most daily new cases while Brazil and the U.S. remain either second or third on any given day. No other nation is even close in numbers.  

But today I want to point out a public health mystery that we can no longer ignore this virus. Why has its mortality rate so dramatically declined from the initial wave in the Northeastern states back in March to the much higher wave in the South and West that we are experiencing now?  What natural phenomenon can so profoundly alter the mortality rates so quickly? 

Take a look at the two graphs of daily cases and daily COVID-19 deaths below. If the mortality rate remained the same, the basic shape of these two graphs should be nearly identical. 

Instead, the early peak of new cases in the Northeast is much lower than the current second wave in the South and West, yet the peak in COVID deaths during the first wave is much bigger than in the current, much large wave of new cases. Has the virus mutated? Have medical interventions improved that dramatically? Or have reporting methodology changes so much? 


U.S. National Health Emergency
Day 175 - September 5, 2020

Comments: No Comments


U.S. National Health Emergency
Day 174 - September 4, 2020


Comments: We are consistently over 40,000 new infections per day and 1,000 deaths per day for the last three days. Despite these terrible numbers of illness and death, India's outbreak continues to worsen and Brazil remains unable to control the spread of the virus as well. As a result, our global percentage of new cases and deaths is declining slowly.  California, Texas, and Florida are still the leading hotspots within the United States, but their numbers of new infections is gradually declining (wear your masks!). What may be happening is that the national infection rates and deaths are remaining consistently high as the infection rates spread out over more and more states. As of today, there are 16 states with over a thousand new cases, and New York is close behind. Despite this rising tide in many states, COVID-19 testing has fallen flat with an average of just 752,000 tests per day over the past three days. The seven day average at the end of last month was 810,000 tests per day. And if all the tests ever given in the U.S. were only administered once per person, only 1 in 4 would people would have been tested by now. Also, though I am not a fan of the positivity rate metric, it did rise yesterday and we should keep an eye on it. 


U.S. National Health Emergency
Day 173 - September 3, 2020


Comments: No commentary today, just the numbers. 


U.S. National Health Emergency
Day 172 - September 2, 2020


Comments: It's hard to grasp the full scale of the U.S. failure to control the spread of new COVID-19 infections without some standard of comparison. Our situation can all seem as if the scale of our outbreaks are what we should expect. This is far from the truth. To illustrate this gap I created a comparison table that matches up the top ten U.S. states with the highest number of new infections over the past 24 hours with countries that had similar numbers of new infections yesterday, and how those countries rank among 215 nations. It turns out that the ten worst states all ranked above the United Kingdom (20th with 1,295 new cases) among the worst countries in the world in controlling the virus. 


U.S. National Health Emergency
Day 171 - September 1, 2020
Comments: The U.S. is starting the month with lower numbers of new infections and deaths than India and Brazil. It is unlikely that the U.S. might move into the fourth spot any time soon since Argentina, the next country with a high number of new cases still has 27,000 fewer cases than do we.  And a reminder, India may have 30,000 more new infections than we have, but they also have a billion more people. Their per capita infection rate is something we should envy. Brazil is the only other country in the world in as bad a situation as the United States, and Brazil's authoritarian leader acts like he is a Trump copycat. It has 118.5 million fewer people than the U.S. and ranks 11th in the world on the number of total cases per one-million people... just behind the United States in 10th place.


No comments:

Post a Comment

Please feel free to comment or make suggestions

Counter